Getting Started
Overview
Website
Forums
What is World Community Grid?
Costs
FightAIDS@Home
Explaining the FightAIDS@Home Agent
Human Proteome Folding
Points
Windows Points Calculation
Linux Points Calculation
Returning Results
Teams
Agent
Troubleshooting
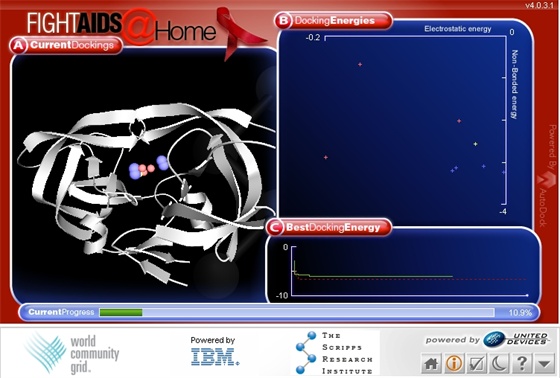
Explaining the FightAIDS@Home Agent
Panel A: Current Dockings
What are the colored spheres in Panel A?
Panel B: Docking Energies
What is electrostatic energy?
What is non-bonded energy?
Panel C: Best Docking Energy
Current Progress Bar
Panel A: Current Dockings
Click on the
on your agent application window in the lower right hand corner. You then will see a graphics window similar to the following:
What is the white arrow, helix and loopy structure?
Ribbon diagrams are simplified drawings of proteins that make it easier for scientists to view and understand what is shape is. The three-dimensional "skeleton" of HIV-1 protease is shown as a white ribbon diagram on the screen and is magnified about 10,000,000 times.
In this panel, you can see the shape that the particular sequence of amino acids in HIV-1 protease makes in three dimensions. For clarity, we are not showing the details of all of the atoms in the protein molecule, just the backbone. Remember, all proteins, including HIV-1 protease, are made up of strings of amino acids, linked like beads on a string. There are twenty different naturally-occurring amino acids, and you can think of them as different kinds of building blocks. These strings of amino acids have parts that like to stick to others while repelling others. The different parts of the protein's amino acid chain clump together into characteristic three-dimensional shapes.
What are the colored spheres in Panel A?
The search algorithm used in AutoDock is not just looking at one possible solution of one candidate drug molecule (ligand) but is actually evaluating many possible solutions at once. The spheres show places where the best drug molecule to HIV-1 protease dockings have been calculated and the color shows how good they are.
AutoDock is trying to find the best way that the current ligand, the one your agent has downloaded, can fit together with the target HIV-1 protease. You can think of the ideal drug we are trying to find as a "key," and the HIV-1 protease as a "lock." Unlike keys in the real world, however, many drug molecules bend to change shape. In this respect, molecules are like a dancer's body; the same body is able to adopt many different poses and shapes. Unfortunately, we do not know what shape a candidate drug will adopt until we try millions of different possibilities and then select the best one.
To find the best fit, we are using an algorithm. An algorithm is just a recipe, a list of ingredients and instructions on how to do or make something. We are actually applying the principles of evolution in our search algorithm to find the best way that our candidate drug molecule would best fit together with the target, HIV-1 protease. Like evolution in the real world, we have a "population" of possible solutions to the problem.
This is what you are seeing when you look at the different colored spheres dotted around the white ribbon diagram. The colors correspond to the same colors of the crosses in panel B. Those representing more negative energy are considered better dockings. AutoDock uses a representation for each of these ligand dockings that says where the ligand's center is, what its orientation is, and what shape it has currently adopted. AutoDock applies genetic operations on the representations of random pairs of ligand shapes to generate two new representations and hence potentially better solutions. You can see how well AutoDock is doing by looking at the graph in panel C.
Panel B: Docking Energies
We see here the energy breakdown for each candidate ligand docking of the current population of possible solutions. The total energy of a ligand binding to the HIV-1 protease consists of an electrostatic energy component and a non-bonded energy component. The electrostatic energy measures how many like-charges and unlike-charges are interacting between the ligand and the protease. The non-bonded energy measures non-electrostatic attraction between the two.
What is electrostatic energy?
You can see electrostatic forces in action if you rub a balloon on a dry wooly sweater, and then gently place the balloon against a wall: It sticks! This is because all objects are made of atoms. Each atom has an equal number of electrons and protons. Electrons have a negative charge, while protons have a positive charge. These charges balance one another exactly to make objects neutral, or uncharged. When we rub the balloon against a sweater, the friction causes electrons to be rubbed off the sweater and onto the balloon. The balloon becomes charged with static electricity, and it now has more electrons than protons, so it is negatively charged; the wall is more positively charged than the balloon so the balloon sticks.
If you were to rub a second balloon on your sweater, and hang the two balloons from a string, you would see the two balloons repel one another.
What is non-bonded energy?
Non-bonded energy arises because atoms are "sticky" when they get close to one another. The amount of "stickiness" depends on the two atoms that are interacting. However, atoms repel one another when they are pushed too close together. Between two touching molecules, there are many of these non-bonded interactions. They are called "non-bonded" because these interactions are not permanent like chemical bonds.
Panel C: Best Docking Energy
We see here the best docking energy in the current population, plotted over the course of the current docking, shown as a green solid line. The red-dotted line shows the same kind of graph, but for the best docking achieved so far. As the current docking proceeds, at the end of every generation, the green graph gets updated.
The vertical axis shows the best energy. The more negative the energy, the better, i.e. the more precisely we predict this particular ligand will bind to the protease. You can see times when the energy is not changing (the horizontal lines in the graph) and times when the energy dropped (the vertical lines) when AutoDock has found a better solution than the previous generation.
Current Progress Bar
The Current Progress Bar shows how much of the current work unit has been completed. The work units are specified by the researchers at The Scripps Research Institute and transmitted via the servers at World Community Grid to your machine. Each work unit has just one candidate drug molecule, out of a vast library of candidate drug molecules we are virtually screening. The software running under the grid agent on your computer is called AutoDock, and it tries to determine the best way the current ligand fits into the target HIV- 1 Protease. When the work unit is finished, the best results are sent back to Scripps via World Community Grid for further analysis, to find the best candidate protease inhibitors for further testing in the laboratory.
隐私权政策
|
站点地图
|
联系我们